Custom Analytics Dashboard for Real Estate
An interactive analytics dashboard for a real estate agency, aggregating listings, sales and live market data into custom charts, filters and exportable reports.
- Year
- 2024
- Engagement
- Data pipeline and dashboard development
- Focus
- Data Engineering, Full Stack
- Status
- Delivered
01 — The problem
Property and market data lived in several sources and was assembled by hand into weekly spreadsheets — slow to produce and out of date by the time anyone read it.
02 — Our solution
A pipeline that pulls every source into PostgreSQL on a schedule, and a dashboard with custom D3 visualisations, filters and one-click reports for client presentations.
How it works
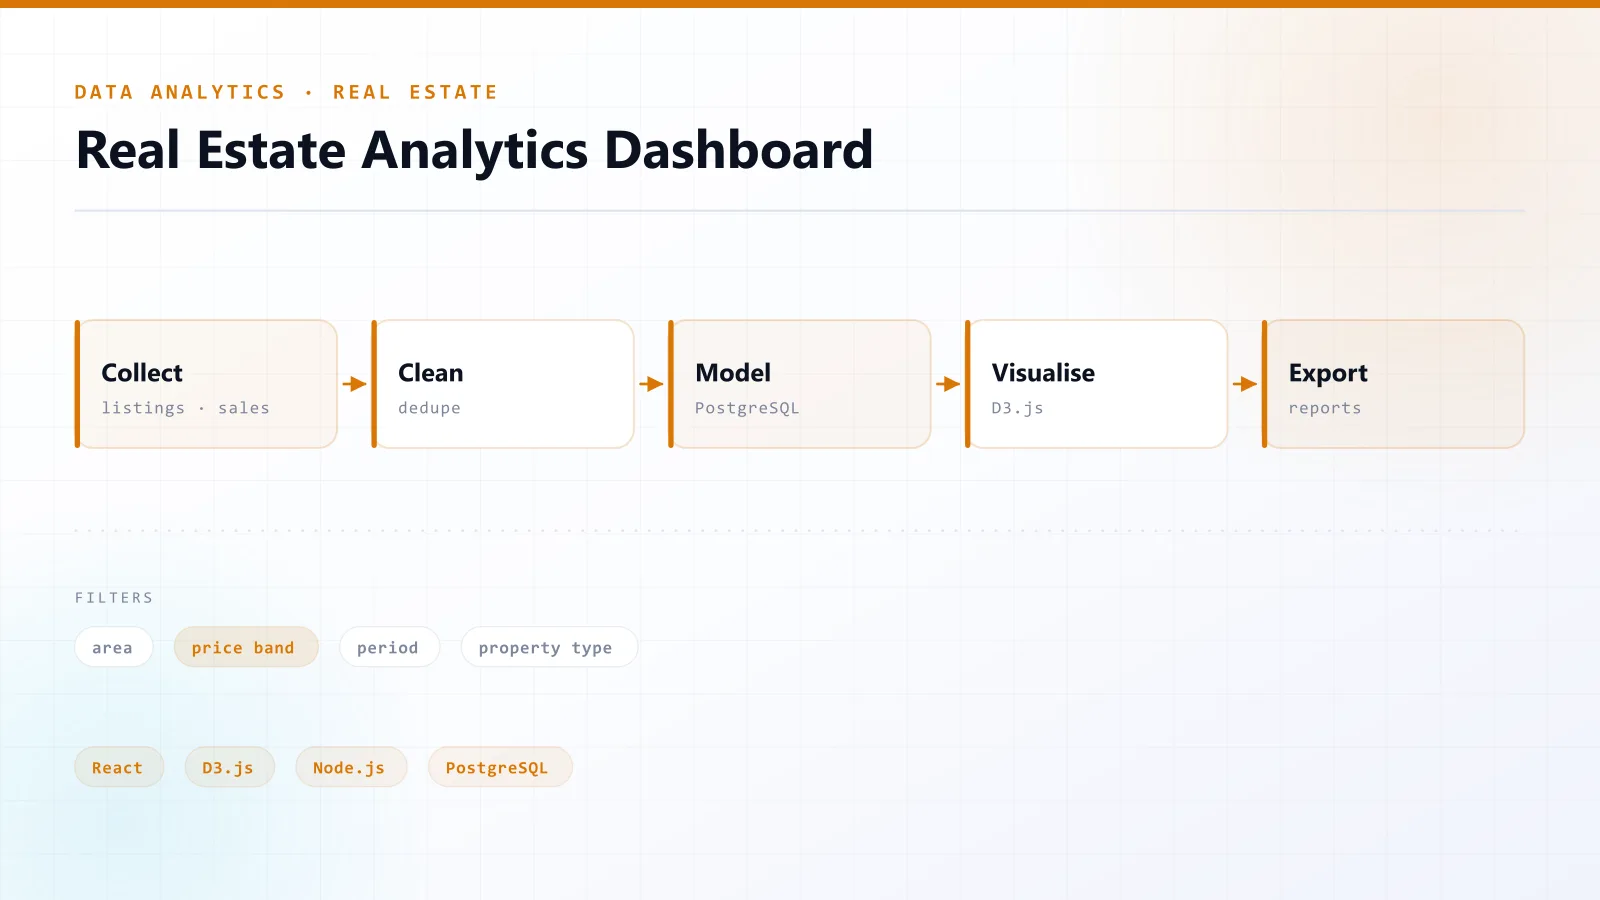
The pipeline, step by step — from the first input to the final output.
- 01
Collect
Listings, sales and third-party market APIs are pulled on a schedule.
- 02
Model
Data is cleaned and modelled in PostgreSQL for fast aggregation.
- 03
Visualise
Custom D3.js charts with filters by area, price band and period.
- 04
Report
Exportable reports for client presentations and internal reviews.
What we built
The outcomes
01
Faster decision making
02
Improved data accuracy
03
Automated reporting
Challenges we solved
Many sources, one truth
Deduplicating listings across sources was the key to numbers the team could trust.
Technology stack
Want results like these?
Book a free 30-minute discovery call. We'll map out your project, recommend the right stack and send a fixed quote within 48 hours.